How does BLAST-XYplot viewer search works
BLAST-XYplot viewer is a web tool that performs a massive BLAST search against whole sequenced bacterial genomes and represents results in an “x,y” plot. This strategy allows the representation of thousands of results at the same time. To do that, every circular replicon (chromosome or plasmid) is projected as a line with fixed length from 0 to 360 which are the degrees in a circle.
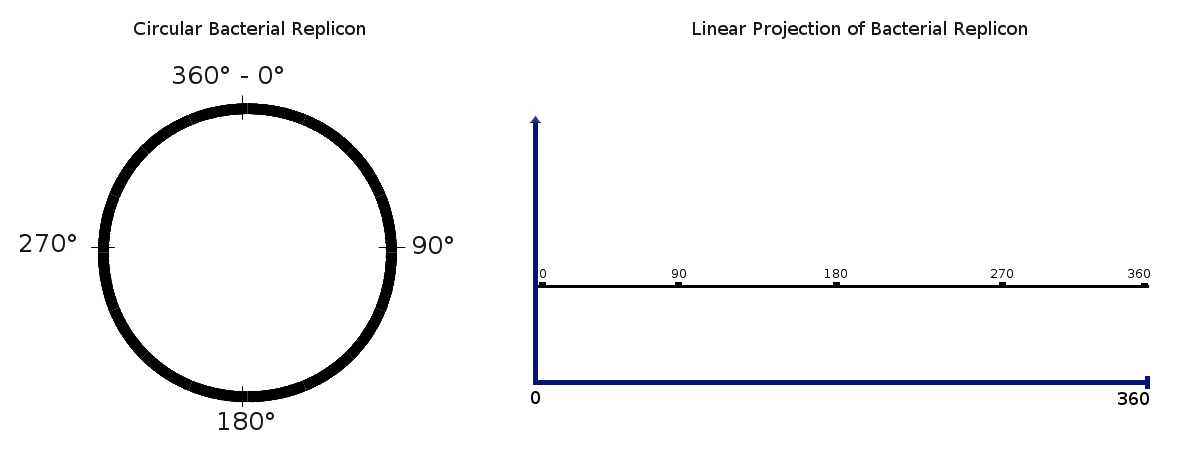
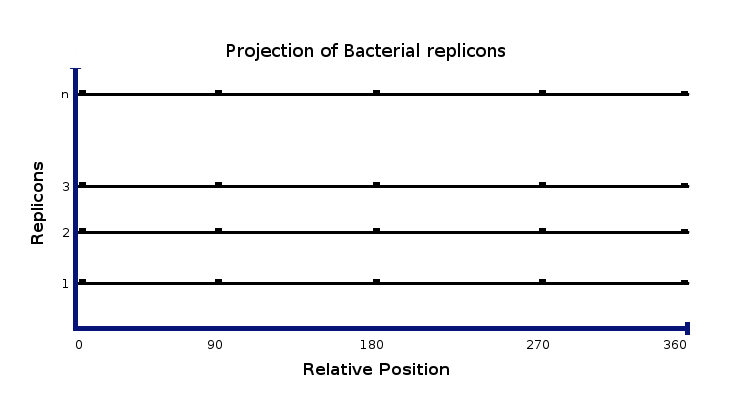
Using this visualization scheme it is possible to represent as many replicons as we need in the same delimited space, from a single one to several thousands.
When searching for a particular gene/protein in a bacterial genome using BLAST, subject sequence (BLAST-result) is represented as a vector with origin in the “x,y” coordinate, magnitude proportional to the length of the gene and direction according to the transcription sense.
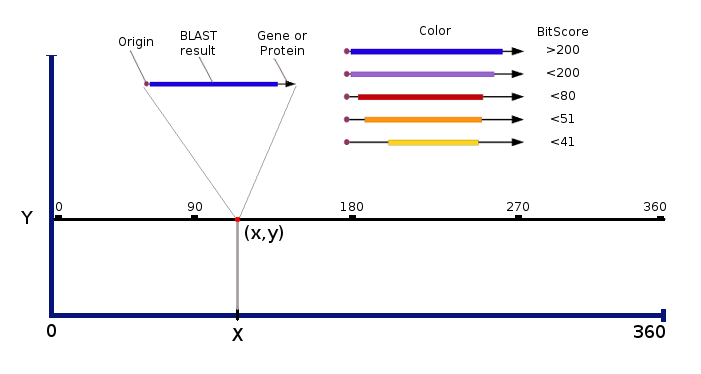
Additionally, a ticker line is plotted over the vector with a longitude proportional to the alignment length between subject and query sequences and color palette indicating the significance. A table of data containing the relevant information of the subjects found is sorted, scored and written to a file than could be analyzed in a basic spreadsheet.
The principal advantages of this visualization method are: 1) if two or more Blast-results are physically close to each other into the genome is easily noticed; 2) BLAST-results that belongs to different replicons can be schematized simultaneously; 3) it is possible to use as many query sequences and replicons as desired at the same time; and 4) the interactivity of a plot, like zooming or dragging, can be used to analyze massive data from the whole results and focusing into a particular site in real time.
Results can be scored in two different ways: The proximity score allows to visualize whether BLAST-results are physically close into the replicon, useful to search for full gene cluster, operons or biosynthetic pathways. On the other hand, the homology score makes easier to determine whether several sequences are present and where are located in the bacterial genomes.
How to perform a BLAST-XYplot viewer search
BLAST search can be performed here.
The parameters needed are:
- Job title: It is a short description of your job.
- E-mail: Because some large jobs run can take several hours, a valid user e-mail address is required to send the link of Results and Plot.
-
Blast Type: It is the kind of BLAST that will be performed.
- PROTEIN will search against annotated proteins (needs aminoacid sequences).
- GENES will search against annotated genes into the genome (needs nucleotide sequence).
- WHOLE-GENOME will search on the whole molecule and as consequence can not give information about product, gene start-end, Locus-Tag, etc. (needs nucleotide sequences).
-
Data Base: Refers to the database used to perform searches.
- GENUS needs enter the name of a desired genus, ig: Escherichia, Enterococcus, Salmonella, Lactobacillus, etc., and automatically all sequenced species present in the database depository will be included in the search.
- TAXONOMIC GROUP will include all genus of a taxonomic group. It could be, for example, a Kingdom "Archaea" or "Bacteria", Phylum like "Actinobacteria", "Proteobacteria", "Firmicutes", etc., or Family like "Burkholderiaceae", "Sphingomonadaceae", "Enterobacteriaceae", etc. It is also possible to set bye Order or Class. When start typing a word, a drop-down list will apear on the box to indicate the available options.
-
E-value:
- The Expect value (E-value) can be used to create a significance threshold for BLAST-results. The E-value is a parameter that describes the number of hits one can "expect" to see by chance when searching a database of a particular size. The lower the E-value, or the closer it is to zero, the more "significant" the match is.
-
Sequences: Finally, sequences can be provided by pasting them directly on the text box
or uploaded as file from the computer's user. In both cases, sequence must be provided in fasta format
and must include header.
- >Header-1
- SEQUENCEONEINFASTAFORMAT
- >Header-2
- SEQUENCETWOINFASTAFORMAT
- ...
- >Header-n
- SEQUENCETHREEINFASTAFORMAT
- Header advices. Header is the identifier for sequences and will be used on the BLAST-results plot and on the table of results, it become relevant and useful on data analysis. It is suggested to select the header nomenclature as short and informative as possible. If you are working with an operon, a good option to define the header could be like this: “>01_mutase”, “>02_dehydrogenase”, “>03_regulator”, “>04_hypothetical”, etc. When you scan thousands of results on the plot, it will be easy to determine the presence/absence, direction and position of all genes/proteins into the full operons. If you work with several sequences of the same protein/gene you could name the headers like this: “>Ecoli_dehydo”, “>Saureus_dehydro”, “>Bsubtillis_dehydro”, etc. It is recommended to avoid special characters (\&%$#”@'/*+{ }[ ] ...).
How to interpret results
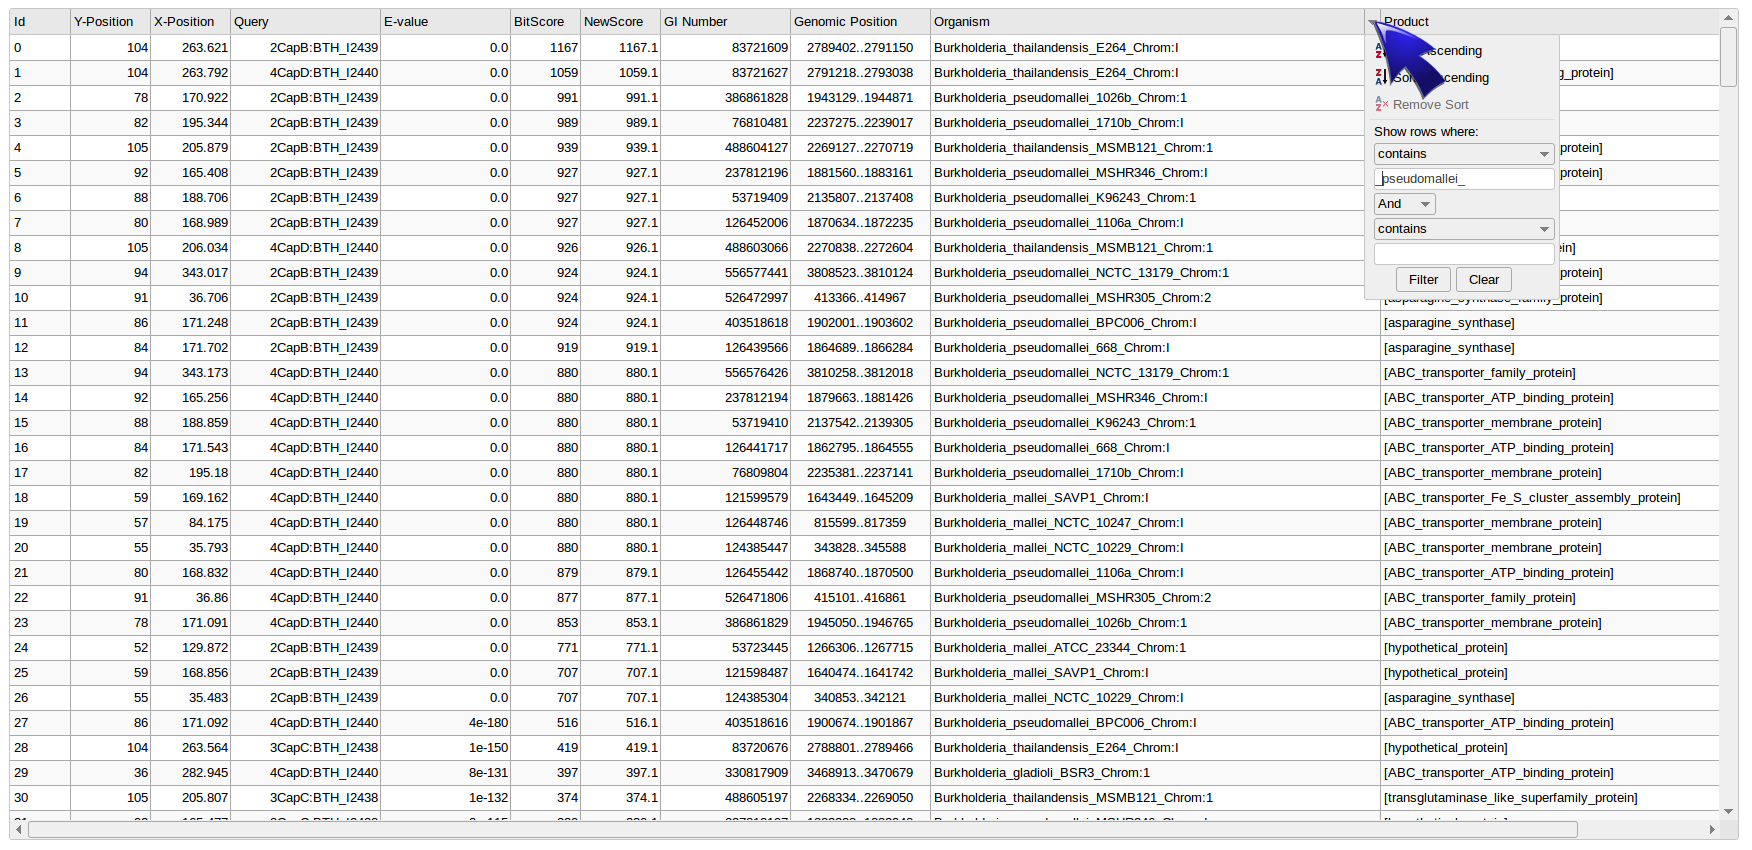
Once the search has been performed you will receive an e-mail with the web link to your results, the Graph and the Table of data. You can open the plot with all data and use the zoom, drag and mouse-over to analyze data as a whole distribution of thousands of BLAST-results or zoom to a particular one.On the other hand you can use the table to sort results by a particular kind of data or condition.
To display the dropdown filter menu, mouse-over the cursor close to the right side of each header of the table and will apear a small triangle, left click on it and configure filter options. Once you have filtered BLAST-results, click on the "Actualize data" button and then "refresh" the Graph web page in order to update the plot.
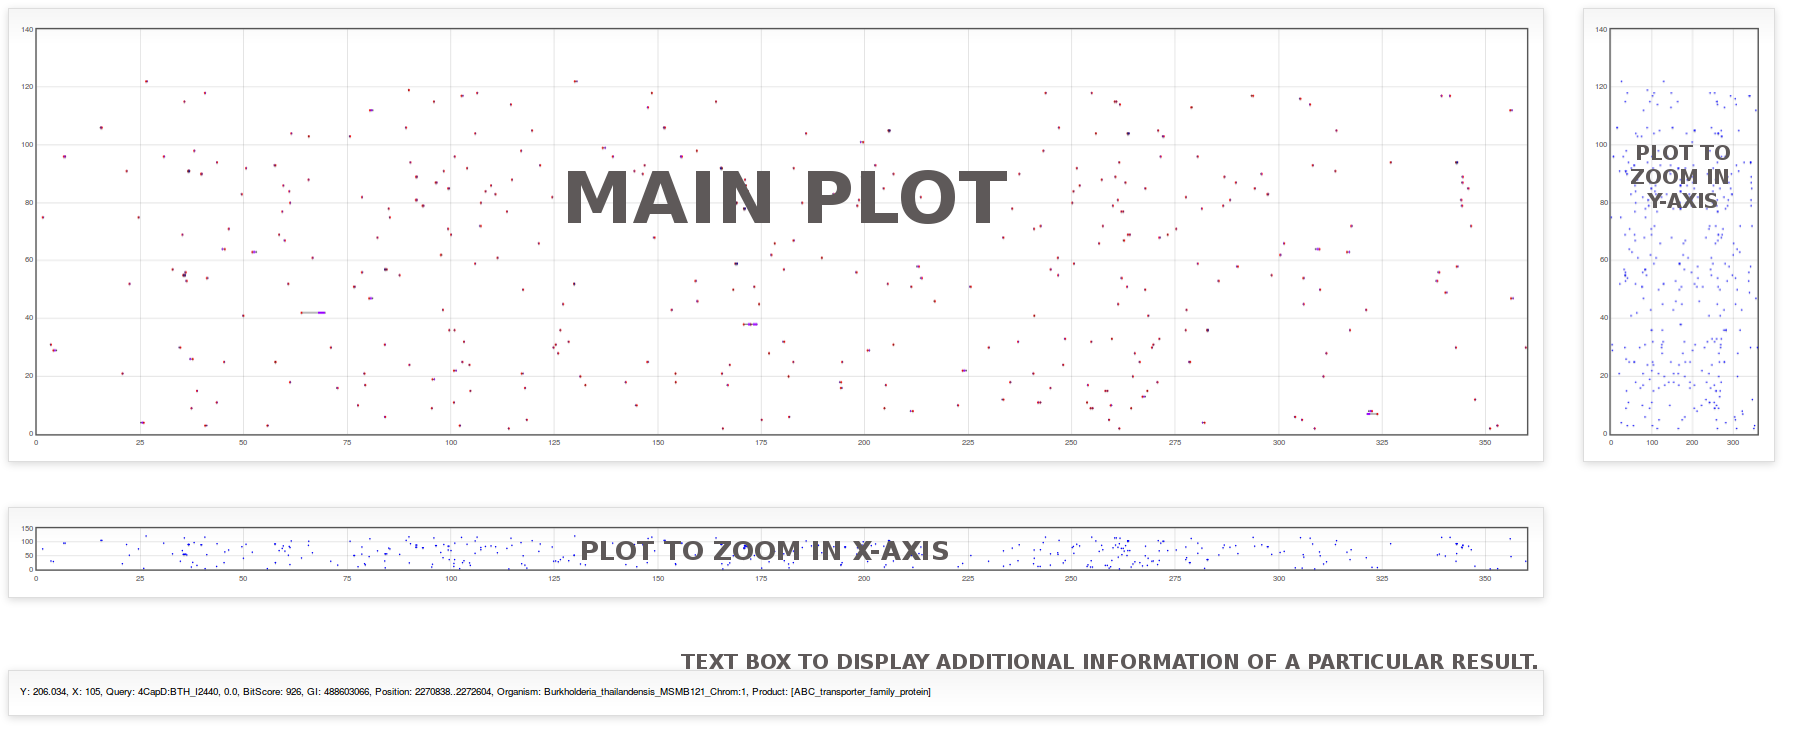
Default plot displays overall data with x-axis covering a range from 0 to 360 and y-axis including all replicons used in the search configuration parameters. Alongside the main plot, there are two plots that allow zoom the data in a particular range. By clicking with the left mouse button and drag it over the plot on the right to select a zone, the main plot will be zoomed in or out in the y-axis representing a subset of replicons in a closer view. Likewise, selecting a zone in the bottom plot will zoom the main plot in the x-axis which represents the relative position of subjects into the chromosomes. When you scan the plot, a window of 20 degrees in x-axis is adequate to visualize individual BLAST-results as well as genes/proteins clusters.
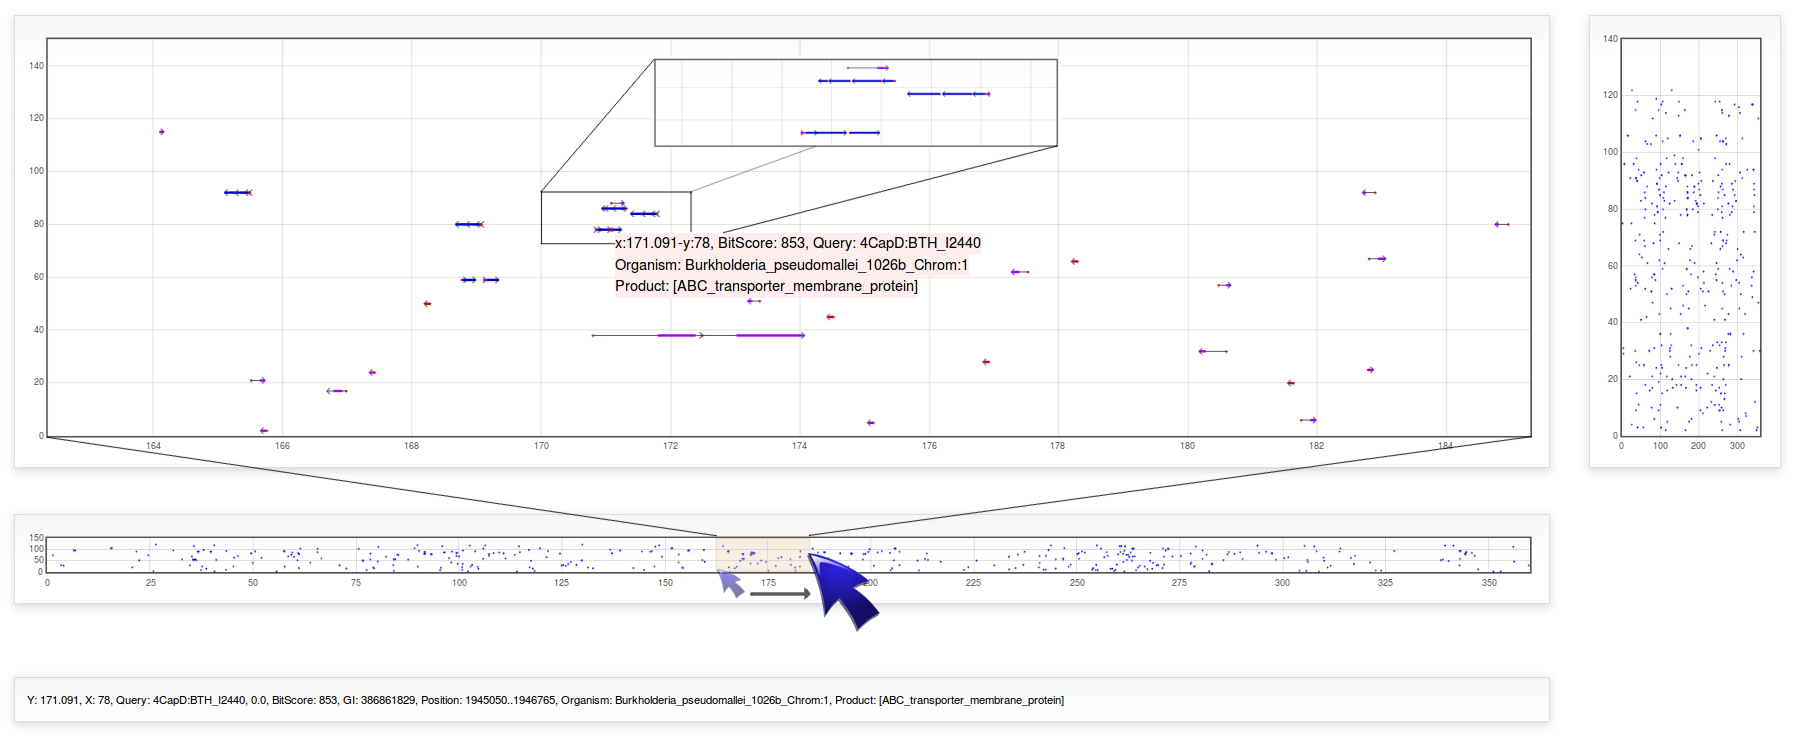
To visualize biological information of a particular Result, mouse over the dot in the main plot and a pop-up text will appear indicating the relative position, bit-score, query, organism and product of that subject. By left clicking on a result, additional information like e-value, GI and real (nucleotide) position will appear on the bottom text box.